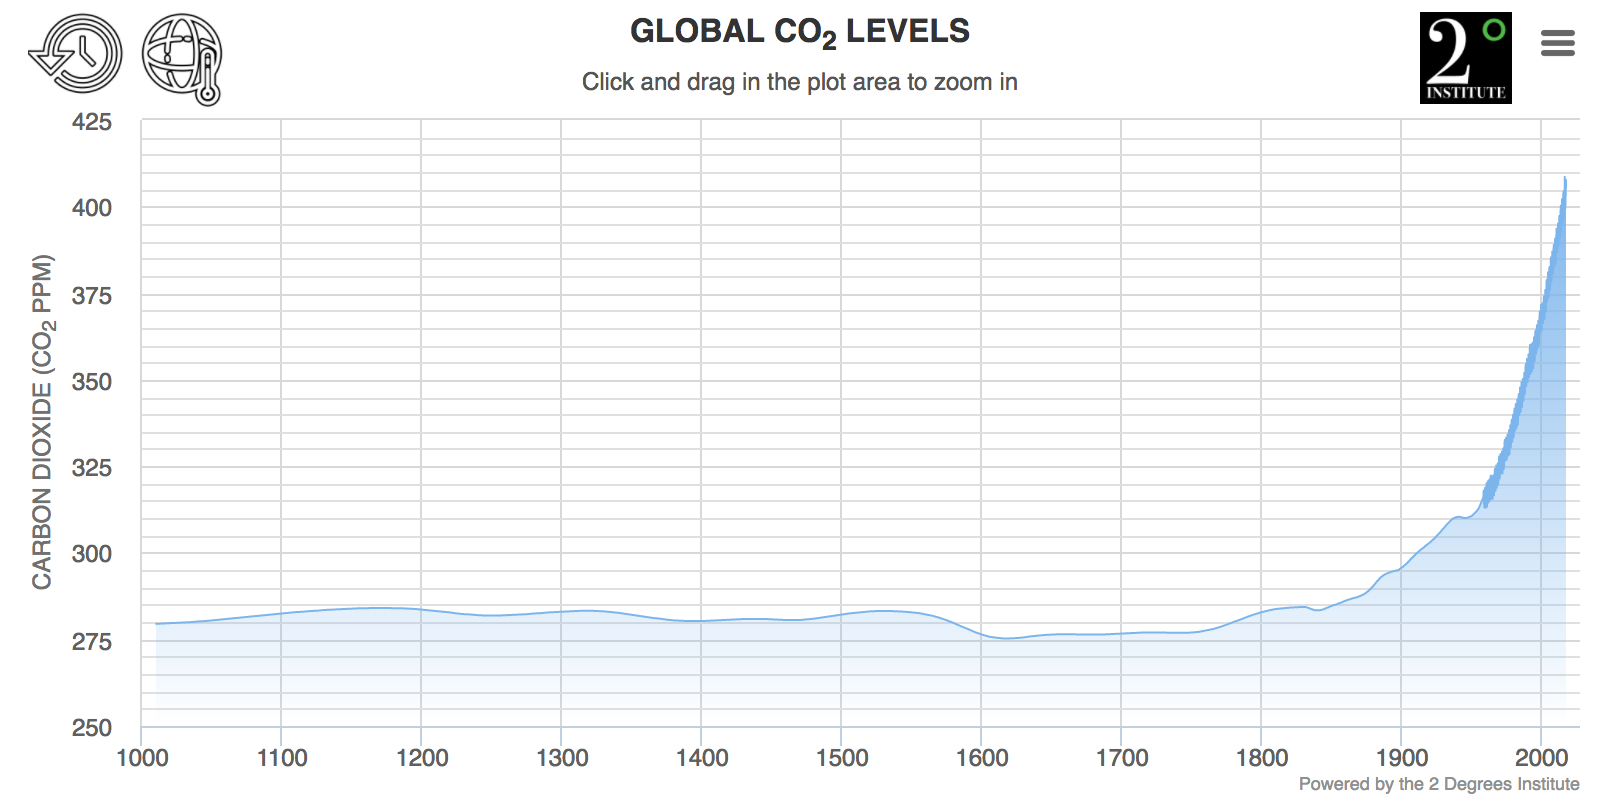
This graph features atmospheric CO2 levels that combine measurements from as far back as 800,000 years up to the present day with an atmospheric temperature overlay option. The graph is customizable and can be resized, printed, or pasted into your website. This is a free service, but we do ask for a donation if you find this useful. This is a project of the 2 Degrees Institute, a non-profit organization.
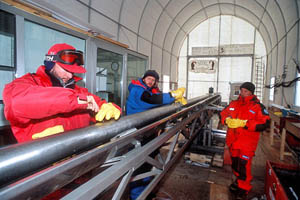
![]() Changes in past atmospheric carbon dioxide concentrations can
be determined by measuring the composition of air trapped in ice
cores from Antarctica. So far, the Antarctic Vostok and EPICA
Dome C ice cores have provided a composite record of atmospheric
carbon dioxide levels over the past 800,000 years.
Changes in past atmospheric carbon dioxide concentrations can
be determined by measuring the composition of air trapped in ice
cores from Antarctica. So far, the Antarctic Vostok and EPICA
Dome C ice cores have provided a composite record of atmospheric
carbon dioxide levels over the past 800,000 years.
Credits: Bernhard Bereiter, Sarah Eggleston, Jochen Schmitt, Christoph Nehrbass-Ahles, Thomas F. Stocker, Hubertus Fischer, Sepp Kipfstuhl and Jerome Chappellaz. 2015.
Learn about temperature data sources.
")
![]() Historical CO2 record from the Law Dome DE08, DE08-2, and DSS ice cores
Historical CO2 record from the Law Dome DE08, DE08-2, and DSS ice cores
Credits: D.M. Etheridge, L.P. Steele, R.L. Langenfelds, R.J. Francey and the Division of Atmospheric Research, CSIRO, Aspendale, Victoria, Australia
Learn about temperature data sources.
")
![]()
![]()
![]() Atmospheric CO2 concentrations (ppm) derived from in situ air measurements
at Mauna Loa, Observatory, Hawaii.
Atmospheric CO2 concentrations (ppm) derived from in situ air measurements
at Mauna Loa, Observatory, Hawaii.
Credits: Dr. Pieter Tans (NOAA/ESRL), Dr. Ralph Keeling, S. J. Walker, S. C. Piper and A. F. Bollenbacher (Scripps Institution of Oceanography)
Learn about temperature data sources.
Dr. Pieter Tans
NOAA's Earth System Research Laboratory
Dr. Jeremy Shakun
Boston College

Dr. Geoff Dutton
NOAA's Earth System Research Laboratory
Dr. Ed Dlugokencky
NOAA's Earth System Research Laboratory